Showing posts with label maps. Show all posts

Wednesday, July 15, 2015

Beer Me a Beer

It's a sudsy world these days.

Between the loosening of brewing laws (locally) and a surge in craft brewing, the booze world in 2015 appears to belong to the beermakers. In 2014, craft breweries generated $19.6 billion of $101.5 billion U.S. beer sales - a 22% increase over the year. That is...a lot of craft beer.

It's no surprise, then, that the beer industry is a strong player in the internet's coveted "people who make cool maps and write listicles using consumer data" market. Just today, I came across three good examples of the genre.

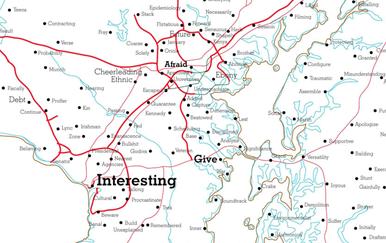
My favorite is the map below. The Priceonomics website, using data pulled from over 6,000 menus from restaurants located throughout the U.S., determined the most commonly listed beers in each state:


The map above, which summarizes those findings, suggests that America is Bud Light Land. Except for Maryland and Virginia...which are Miller Lite Land. Interesting. Also interesting: that South Carolina is a little pocket of Yuengling Country. And that Okies love Stella. Who knew?

But wait, there's more.

Using Beer Advocate data, the website Cool Material created a list of the most highly rated beer from each state. In Maryland, it's Duckpin from Union Brewing - a brew that is, these days, almost as common on restaurant menus as Natty Boh.

The Chive mined data from Thrillist and the Beer Hunt app to put together a list of the most popular craft beers from each state. I have to kinda question their methodology, though...because Natty Boh was listed as Maryland's beer. I'm pretty sure that no matter what definition of "craft" you're using, something brewed by a major international brewer shouldn't fall in that category. (Unless, I guess, it has more to do with limited distribution area than brewer. But that still seems wrong.)

Unsurprisingly, Delaware is allll about the Dogfish Head - on all of these lists. The actual beer might vary but there's no doubt that DE is Dogfish country.

Wednesday, January 21, 2015

Trend Mapping

On Facebook this morning, I discovered an infographic - courtesy of Kathy - that was absolutely calling my name. Put together by a British company called thefoodpeople, it's a graphic representation of 2015 food trends, including several fairly specific food trends (things like the rise of fermentation and multiple condiments on the table), how broad food trends fit with larger consumer trends, flavor markers (smoke, hay, spice, etc) and how national cuisines fit as overall influencers. Needless to say, I am all about it.

Trends have been on my mind lately, as they often are at the end of one year and the beginning of the next. In past years, I've made my own predictions and written summaries of others' predictions. I didn't get to that this year...but I did just write an article about McCormick's flavor forecasting efforts. (It appears in the Sun today.)

I found one piece of thefoodpeople's infographic, the cuisine influence map, especially interesting. The map charts different cuisines in terms of trend influence and market appeal - it seems very useful for people thinking about food marketing and product development:

It caught my eye, in part, because I'd just spotted this map, also someplace on Facebook:


Many of the above findings are no-brainers. Steak in Wyoming? Yes. Southern food in the South? Tex-Mex in Texas? Who could've guessed? But Maryland and Virginia are more into Peruvian cuisine than the rest of the country. That was a bit of a surprise. I'd noticed an uptick in Peruvian joints around Baltimore...but I didn't realize it was a regional phenomenon.

So it's interesting to me, then, to see that on the cuisine map above, Peruvian cuisine is about average in terms of trend-setting but it's fairly low on the market appeal scale. The cuisine map is not about the US - or at least not all about the US - and doesn't deal in any regional cuisines, so the two maps don't sync perfectly. But still, the overlap is interesting.

Food for thought, as they say.

Thursday, January 15, 2015

Speaking of Regionalism...

VinePair totally just got me with this map:

Is it totally reliable? No chance. There aren't even any actual sources attached, so even the wine vs. beer attributions are suspect. But still, it's cute. And it made me laugh. And...maps!

Thursday, September 25, 2014

Words

Longtime M&G readers know that I love me some food-related intellectualizing. And yesterday was a banner day for just that.

First, I ran across this FWx article about a recent academic paper, authored by a team from the University of Arizona, that examines Twitter language related to food. The map below, which shows, by state, the food term that was "trendiest" between October 2103 and May 2014. (Yes, I know that "trendiest" is not really scientific - and it's my word, not the authors' - but it's the quickest way to describe what they're trying to achieve. They eliminated words used broadly on a national scale but this study does show where words spike regionally - it's not one of those maps that shows the most distinctive word by state.)


The big finding in the map above? It's all about the grits.

The paper itself is wonky but for research and/or food geeks (or both, like me) worth a read. There are some findings related to politics and health matters. Nothing wildly surprising...but interesting, nonetheless.

*****

But that wasn't the end of yesterday's nerdy food and language reading. Last night, Cail sent me a link to this totally interesting Financial Times article about menu and review language. The article's author, Dan Jurafsky, is a linguistics and computer science prof at Stanford. He has recently published  book called The Language of Food: A Linguist Reads the Menu, which I just - a few minutes ago - downloaded to my Kindle.

I can't wait to read it, as the article has some great teasers. Like this: when describing food that's delicious, people use the language of sex to describe expensive foods ("seductive" or "voluptuous" for example) but when they're talking about cheap foods, they use the language of addiction ("craving" or "like crack").

That kind of finding is my favorite. I read it and thought, "Of course! That's exactly what happens!" - but I'd never noticed it, even though I do it in my own writing.

Wednesday, January 09, 2013

Tube Evolution


My sister just sent me a link that is so up my alley. It's a short article about the London Tube turning 150 - and the evolution of its iconic map from a more traditionally-drawn diagram to the angular, modern schematic we're familiar with today.

The basis for the current map was actually drawn back in 1931 by Harry Beck (that picture at the top is the 1933 version). It's amazing how totally fresh it still looks today.

If you're at all interested in old maps and changing graphics, check out the link. You won't regret it.


Friday, June 03, 2011

The United States of Online Dating: Maryland In Words

Last night, my college friend Tricia posted this amazing link on Facebook. An artist named R. Luke Dubois mined data from 20 online dating sites and created detailed maps of the entire U.S., replacing place names with the words most frequently used in the online profiles.

The results are revealing, if not always surprising. LA is Acting, Richmond is...Tobacco.

And Maryland. Maryland is Crabs, but apparently only if you live in a little pocket of Kent Island. Other than that, Maryland is Interesting and Afraid and Give - guess which one of those three is in the middle of Baltimore City. (Interesting is outside DC and Give is Annapolis.)

Here's what the state looks like as a whole:
And here's a close-up of the middle section of the state, where most people live. To give you some perspective, the Bay Bridge is right in the middle, just to the right of Give:

As it turns out, I grew up in a community called Discipline (unsurprising, in so many ways) and now I live in Future. I liked seeing all of Severna Park - Analysis is right up the river from Discipline - and Future seems like a pretty appropriate place to settle down.

I do wonder, though, how Timonium somehow became Epidemiology. Academic? Or just creepy?

Wednesday, January 26, 2011

Inbred Grapes

DC Jason just sent me a link to the new food portal on Good, where this immediately caught my attention:

It's a diagram mapping the genetic closeness of  wine grapes, created by Cornell genetic researcher Sean Myles. Myles mapped the genetic makeup of 583 varietals and found that 75% of them are "close cousins who don't have a lot of sex." In other worse, our grapes are as inbred as 18th century royal families. Well, we do call them "noble."

This has some real implications for grape production - namely, that lack of genetic variation could make it easy for disease and pests to do their dirty work. But what I'm most interested in is the way the grapes relate to one another. Seeing the close proximity between Pinot Noir and Chardonnay is just as interesting as seeing how far those grapes are from Cab and Merlot. I think of Cab and Chardonnay as opposite sides of the same coin, but after looking at this diagram, I realize that's probably because of the way the two grapes are treated by winemakers, not because of the grapes themselves.

Also, check out Traminer. Who knew it was at the center of so much activity?!

Friday, April 30, 2010

Alexander Calder Drew This Map

Slate has just published its follow up to last month's request for amateur maps (I wrote about it here) - and I love it. The information in the article isn't wildly surprising, but it's interesting, and the maps themselves seriously kick ass. The one above really was drawn by Alexander Calder (an historian from the Smithsonian shared it with Slate).

Reading this has me back on my "food-mapping" kick - and this time I've actually been playing with some ideas. I'm working on a way to tell a personal food story visually - maybe combining a geographical map and timeline to chart important food moments. Cool, I think, if I can just work it out.

Tuesday, March 16, 2010

Designing Tuesday: Amateur Maps Are Cool


I'm starting to think that maybe I should've gone into cartography. My cousin Kevin is a cartographer. Doesn't that sound like a cool job?

Then again, we're really all cartographers, aren't we? We all draw maps, anyway. That's what this short Slate article is about.

A UK professor of graphic design and typology named Paul Stiff has dedicated most of his life to studying the maps that regular people quickly dash off to show their friends and acquaintances how to get someplace or how to find something. His theory is that by examining the way we create maps spontaneously, professional map-makers and sign-makers can develop a better understanding of the way people really use maps.

User experience + maps? These are a few of my favorite things.

I missed the deadline, but Slate was collecting hand-drawn maps from readers, which they'll publish in a slideshow later this month. I'll be watching out for it.

And, as I've mentioned before, for me, this does have a connection to food. I still think that food-mapping a city would be a fantastic project. It's on my list, too. Along with a million other things, but it's on the list.

Wednesday, March 03, 2010

Cool, Over, Never, Intriguing

  • Cool: I rarely drink Australian wine anymore (I, like many people, got Yellowtailed out when I first got into wine), but I'm certainly not immune to the adorable map that illustrates this Food & Wine overview of Australian wine regions. Cutely drawn maps are my crack cocaine.
  • Over: I'm not saying Turkey's not probably a super cool place. I bet it is. But this is hardly the first article I've read about sailing off the coast of Istanbul. It looks like a gorgeous country and I have it on good authority from my friend Bert, who would know, that Turkish women are some of the most beautiful in the world. But still, how many sailing-in-Turkey articles can be written? (P.S. Sorry to Rasim, my friend since kindergarten, who is Turkish. But I'm pretty sure I'm right.)
  • Never: I have watched enough Travel Channel shows to know that I am never going to want to eat like an Icelander, no matter how healthy it is.
  • Intriguing: In non-Food & Wine news - non-food news, if you want to be picky about it - I found this Galley Slaves post on what makes an alpha male completely fascinating. Also, revealing. Let's just say it potentially explains a lot about my early 20s, all the way up to the point when I met Cooper. Plus, I do like a nice psycho/socio/anthropological theory.

Wednesday, December 16, 2009

But What about Food Geeks?

Via Discovery Doug, who pointed out the glaring absence of anything food related.

Wednesday, November 04, 2009

Mapping McDonalds

This map is getting a lot of buzz, and rightly so. Creator Stephen Von Worley was inspired by a trip down California's I-5, when he was startled (back into consciousness?) by the appearance of a strip mall out in the middle of nowhere. His goal - and I think he achieved it - was to answer the question, "Just how far can you get from a generic convenience?"

Using McDonalds as the handy stand-in for "generic convenience," he gets an answer: 145 miles. That's in the contiguous US, of course.

Cool on so many levels. First - pretty. I'm all about the visual representation of this data. It's fantastic. But I'm even more about the cultural statement that this makes. There's a lot of talk about the homogenization of America (which has both its good and bad points) - this is fantastic fodder. Food availability is an excellent way to talk about culture and behavior.

I wish there was a simple way to create a partner map - something that shows the concentration of family-owned, non-chain casual dining establishments in the U.S. That would be nearly impossible to create, and certainly impossible to keep current, but it would offer a great contrast to this map - it would really add to the discussion.

(via Strange Maps)

Thursday, May 21, 2009

Vino by the Litre

Everybody knows I love, love, love a cool map. So you can imagine how excited I was to come across a website called Strange Maps, devoted to nothing but, well, strange maps (via Manolo). Not even halfway down the first page, I came across this gorgeous piece of statistical representation:

My favorite maps, or graphs, or charts, or whatever you want to call them, are like this - they take dry statistics and convey them in a completely visually compelling manner. On Strange Maps, each map comes with a couple of paragraphs of analysis and discussion, making it a really valuable resource.

And as for this map, I would put it in my kitchen in a heartbeat (or the wine cellar). My favorite finding is that the US drinks wine at roughly the same rate as Finland. So random, so interesting. Surprising? I'm not sure.

LinkWithin

Related Posts with Thumbnails